 Polytoolhub
What is Polymarket Lens?
Polymarket Lens asks how quoted probabilities compare with eventual outcomes. It groups resolved markets into probability bins, shows a calibration chart and lists questions with large price-to-outcome gaps. It also displays current spread comparisons. The historical probability is reconstructed from a monthly-change field, so the result is an exploratory proxy rather than a clean fixed-horizon forecast dataset.
Who it is for
- Readers learning how probability calibration is measured
- Researchers exploring surprising resolved markets
- Developers studying a small public client-side analytics project
Features and coverage
- Available on
- Web, Open-source repository
- Markets & venues
- Polymarket
- Research topics
- Calibration, Forecast evaluation
- Calibration plot
Compare each probability bin with its observed Yes-outcome frequency and the diagonal reference line.
- Per-bin sample counts
Inspect how many markets support a point instead of reading every bin equally.
- Summary metrics
Review Brier score, directional accuracy and average outcome surprise.
- Resolved-market table
Find large differences between the reconstructed probability and the final outcome.
- Active spread comparison
Compare the widest and tightest bid–ask gaps returned by the current data.
- Visible methodology
Read the probability reconstruction, volume filter and exclusions on the same page.
- Public source code
Inspect or adapt the MIT-licensed browser application.
Workflows with Polymarket Lens
Read the calibration chart
Choose a bin, inspect its sample count and compare the observed outcome frequency with the predicted level. Use the plot values directly when interpreting the direction of the gap.
Investigate a surprising result
Open an entry in the resolved-market table and inspect the original question, timeframe and resolution.
Reuse the analysis method
Read the source and replace the monthly-change proxy with timestamped historical observations if your study requires an exact forecast horizon.
Pricing and total cost
Free public dashboard with an MIT-licensed source repository. No account or API key is required for its client-side data requests.
Getting started
Before you start: The reconstructed probability uses final price minus oneMonthPriceChange; that trailing field may include resolution and does not establish an exact one-month forecast horizon.
- Open the dashboard and let the public data load.
- Read Methodology before interpreting the metrics.
- Inspect the calibration chart and per-bin counts.
- Open individual resolved markets from the surprise table.
- Use the repository if you want to reproduce or change the computation.
Useful links
What to check
- The reconstructed probability uses final price minus oneMonthPriceChange; that trailing field may include resolution and does not establish an exact one-month forecast horizon.
- Markets below $5,000 volume and those without meaningful price change are excluded, which changes the sample.
- The generated overconfidence and underconfidence labels can conflict with the displayed gap direction; read the actual bin values.
- A wide spread can reflect low liquidity and is not by itself evidence of a profitable trade.
A closer look
Ratings & reviews
User reviews 0
The main score switches to user ratings after 5 published reviews.
A specific example helps the next person choose the right tool.
Write a review
How was your experience with Polymarket Lens?
Share what you used, what worked and what could be better. We confirm your email and review the submission before publishing.
To submit a review, email info@polytradingbot.com with the tool name, your rating and your experience. Enable JavaScript to prepare a draft here.
Related tools
Browse category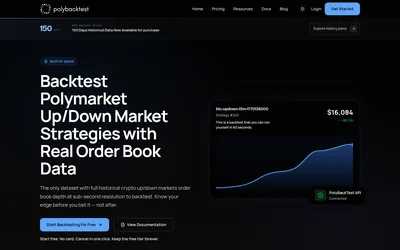
Replay crypto Up/Down markets using historical order-book depth and timestamped data.
- Access Web · API
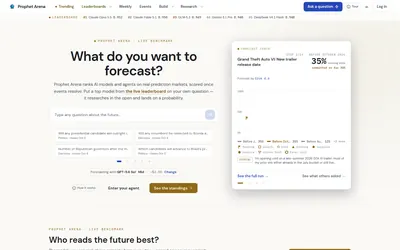

Compare AI forecasters using resolved-event scores, then run a model on your question and inspect its research trace.
- Access Web
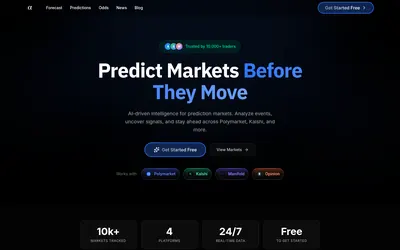

Turn a market link, question or screenshot into an AI forecast and compare it with market odds and news context.
- Access Web
Frequently asked questions about Polymarket Lens
Does the tool need my wallet?
No. It fetches public data in the browser.
What is the historical price proxy?
Final outcome price minus the market’s oneMonthPriceChange field.
Can I inspect the source?
Yes. The linked GitHub project is MIT licensed.
Does the spread table execute trades?
No. It is a research display of returned bid–ask gaps.