 Polytoolhub
What is AI Bubble Oracle?
AI Bubble Oracle aligns historical dot-com-era series with current AI-era indicators. A tree combines valuation, concentration, capital investment, speculative activity and monetary context into higher-level projections. Its value is in exposing the assumptions and counterexamples: several metrics can produce no projection when they do not fit the analogy.
Who it is for
- Researchers studying technology-cycle analogies
- Users testing sensitivity to historical anchor choices
- Readers comparing macro context with related prediction markets
Features and coverage
- Available on
- Web
- Markets & venues
- Polymarket
- Metric hierarchy
Expand parent and leaf indicators in a roll-up tree.
- Historical alignment
Compare the two eras on a shared normalized clock.
- Anchor controls
Choose alternative starting events for either era.
- Smoothing options
Switch between one- and three-month smoothing.
- Matching rules
Compare first crossing with the dominant-climb match.
- Weights
Inspect and change parent contributions.
- Counterexamples
Keep metrics that do not fit the analogy visible.
- CSV export
Download the displayed analytical data.
- Projection drift
Sort by the movement of estimated dates.
Workflows with AI Bubble Oracle
Inspect a headline projection
Expand its branches and identify which metrics contribute most.
Test assumptions
Change anchors, smoothing and matching rules and compare the resulting dates.
Read counterevidence
Inspect no-projection metrics before accepting the historical analogy.
Pricing and total cost
The public experimental dashboard is accessible without a displayed paid plan.
Getting started
Before you start: The projected date comes from a historical-shape analogy, not a separately calibrated event probability.
- Open Then and Now.
- Expand a metric branch.
- Read Options & assumptions.
- Compare alternative anchors and smoothing.
- Inspect no-projection series.
- Export data if needed.
Useful links
What to check
- The projected date comes from a historical-shape analogy, not a separately calibrated event probability.
- Shorter anchor histories can make dates unstable or push them beyond the display horizon.
- Centered smoothing uses a different information structure from a real-time trading signal.
A closer look
Ratings & reviews
User reviews 0
The main score switches to user ratings after 5 published reviews.
A specific example helps the next person choose the right tool.
Write a review
How was your experience with AI Bubble Oracle?
Share what you used, what worked and what could be better. We confirm your email and review the submission before publishing.
To submit a review, email info@polytradingbot.com with the tool name, your rating and your experience. Enable JavaScript to prepare a draft here.
Related tools
Browse category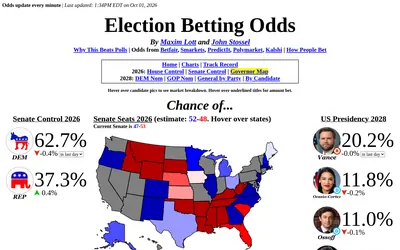
Compare election probabilities across venues, inspect bid–ask ranges and follow historical charts and state-level maps.
- Access Web
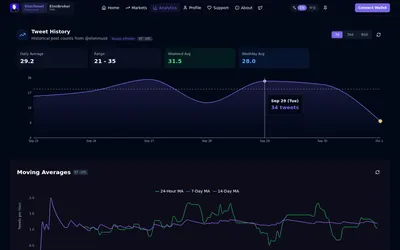

Research tweet-count markets with live totals, posting heatmaps, pace projections and a multi-range calculator, with a linked Telegram bot.
- Access Web · Telegram


Compare Polymarket and Kalshi prices in a sports screener and a market-pulse view for equities, crypto and macro events.
- Trading mode Read-only
- Access Web
Frequently asked questions about AI Bubble Oracle
Why do some metrics show no projection?
They do not fit the selected dot-com analogy.
Can assumptions be changed?
Yes, including anchors, smoothing and weights.
Is the headline a market probability?
No, it is a model timeline under those assumptions.