 Polytoolhub

What is Prediction Graph?
Prediction Graph represents traders, market questions and outcome tokens as different node types joined by trading activity. The reviewed public graph was populated, with timeframe, volume, trade-count and filter controls.
The graph shows shared exposure across wallets that can be hard to spot in separate tables. A graph relationship records activity, not proof that wallets belong to one person or coordinate intentionally.
Who it is for
- Wallet researchers looking for shared exposure
- Traders who prefer a network view of market activity
Features and coverage
- Available on
- Web
- Markets & venues
- Polymarket
- Activity graph
Explore connected trader, token and market nodes.
- Bulk search and filters
The product documents wallet, market and token lookup with activity filters.
- Strategy and order context
The interface description includes a token basket, cost-versus-payout view and wallet-based order workflow.
Workflows with Prediction Graph
Investigate shared exposure
Search related wallets or markets, then inspect which outcome tokens connect them.
Compare a token basket
Review the documented strategy-cart cost and payout assumptions before considering any orders.
Pricing and total cost
The public graph was accessible. Current premium or execution fees were not established.
Access: Public exploration works without a wallet; trading requires a wallet connection.
Getting started
- Open the app and dismiss the graph tour.
- Choose a timeframe and search or filter the graph.
- Inspect node types and the underlying market before interpreting a relationship.
Useful links
What to check
- The leaderboard ranks volume and activity, not proven skill. No basket execution or portfolio-accounting benchmark was performed.
A closer look
Ratings & reviews
User reviews 0
The main score switches to user ratings after 5 published reviews.
A specific example helps the next person choose the right tool.
Related tools
Browse category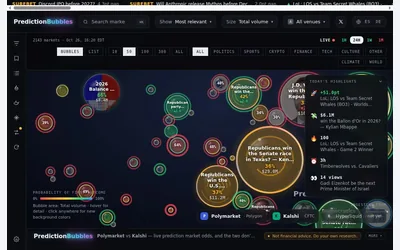

Visualise Polymarket and Kalshi markets as bubbles sized by activity and coloured by probability.
- Access Web
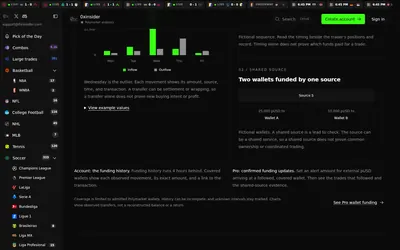

Compare Polymarket sports prices with profitable-wallet positions, inspect trader grades and track large trades through a dashboard or API.
- Access Web · API · MCP
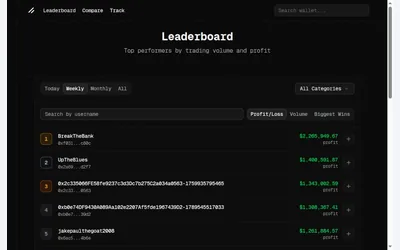
Research Polymarket wallet PnL, positions and trader rankings before deciding which activity to follow.
- Access Web
Frequently asked questions about Prediction Graph
What do the different shapes represent?
The tour identifies circles as traders, triangles as tokens and rounded squares as markets.
Does an edge prove coordination?
No. It represents observed trading activity and needs additional context.
What does Prediction Graph cost?
The public graph was accessible. Current premium or execution fees were not established.
What access does Prediction Graph require?
Public exploration works without a wallet; trading requires a wallet connection.