 Polytoolhub

What is PredictionBubbles?
PredictionBubbles turns a market list into a visual map. Users can change the time window, category, venue and bubble-size measure, then move between the map and list view.
This makes concentration and movement easier to notice at a glance. Bubble size is not conviction: the selected metric can be total volume, recent volume, liquidity or another measure, while colour refers to the first outcome’s probability.
Who it is for
- Visual researchers looking for unusual market activity
- Users comparing Polymarket and Kalshi discovery
Features and coverage
- Available on
- Web
- Markets & venues
- Polymarket, Kalshi
- Bubble map
Represent markets with size and colour tied to the selected data measures.
- Flexible filters
Change venue, category, timeframe and number of displayed markets.
- Highlights and list view
Inspect notable moves or use the conventional list when labels overlap.
Workflows with PredictionBubbles
Spot unusual activity
Choose a category and recent timeframe, then inspect the largest moves and their underlying questions.
Compare visual measures
Switch from volume to liquidity before assuming a large bubble represents an easily tradable market.
Pricing and total cost
The reviewed map was publicly accessible. A paid plan was not established.
Access: Public exploration works in the browser without a trading connection.
Getting started
- Open the map and dismiss the introductory tour.
- Select venue, category, timeframe and size metric.
- Open an interesting market and verify the original contract.
Useful links
What to check
- Hyperliquid was labelled not yet ingested. Gap or surebet labels require independent checks of contract equivalence and execution.
A closer look
Ratings & reviews
User reviews 0
The main score switches to user ratings after 5 published reviews.
A specific example helps the next person choose the right tool.
Related tools
Browse category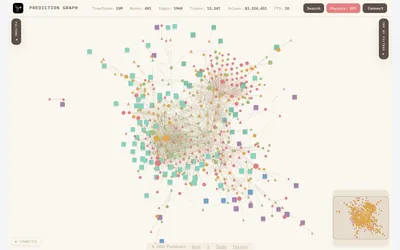

Explore Polymarket traders, markets and tokens as a connected activity graph.
- Access Web
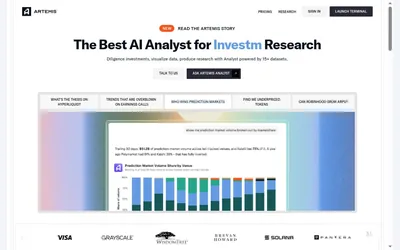

Research prediction markets alongside other financial data, ask scoped questions, and take results into charts or spreadsheets.
- Access Web
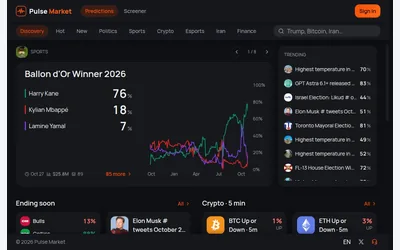

Browse Polymarket markets with probability charts, category filters and a dedicated screener.
- Access Web
Frequently asked questions about PredictionBubbles
What does bubble size mean?
It depends on the selected metric; it should not automatically be read as liquidity or confidence.
Does the map include Hyperliquid?
The reviewed interface explicitly marked it as not yet ingested.
What does PredictionBubbles cost?
The reviewed map was publicly accessible. A paid plan was not established.
What access does PredictionBubbles require?
Public exploration works in the browser without a trading connection.