 Polytoolhub
What is PolyChart?
PolyChart overlays a chart panel on an event page and retrieves price history from Polymarket’s CLOB API. It can be moved, resized and minimized while the underlying market remains visible. Free covers longer candle intervals; Pro adds short intervals and technical-analysis controls.
Who it is for
- Users who prefer OHLC candles to probability lines
- Researchers comparing several outcomes
- Desktop users setting market-price alerts
Features and coverage
- Available on
- Chrome extension
- Markets & venues
- Polymarket
- Research topics
- Candlestick charts, Price alerts
- Floating panel
Move, resize or minimize the chart.
- Automatic outcome detection
Load the event’s available outcomes.
- Free candle intervals
Use 1-hour, 4-hour and daily OHLC views.
- Pro short intervals
Add 5-minute and 15-minute charts.
- Indicators
Pro lists MA20, EMA12, Bollinger Bands, RSI14 and MACD.
- Outcome overlays
Compare up to eight outcomes on one chart.
- Desktop alerts
Background checks run at 60-second intervals.
- CSV export
Export timestamp, OHLC and the provided volume field.
- Local preferences
Retain panel and alert settings.
Workflows with PolyChart
Inspect price structure
Open the exact event and choose an outcome and candle interval.
Compare outcomes
Overlay related outcomes and check whether their patterns actually differ.
Set an alert
Choose the threshold and confirm browser notifications are enabled; expect polling rather than tick-level delivery.
Pricing and total cost
The store lists free core charts and three Pro purchase options.
Free
$0
- 1H, 4H and 1D candles
- OHLC crosshair
- No wallet or trading account connection
Pro monthly
$12.99/month
- Short intervals
- Indicators
- Overlays
- Alerts
- CSV export
Pro annual
$129/year
- Pro features
Pro lifetime
$89 once
- Published lifetime offer
Getting started
Before you start: The documented volume series is proxy volume, not a complete record of traded volume.
- Install from the official Chrome listing.
- Open a supported Polymarket event page.
- Choose the exact outcome.
- Position the floating chart.
- Select interval and optional indicators.
- Enable notifications only if using alerts.
Useful links
What to check
- The documented volume series is proxy volume, not a complete record of traded volume.
- Alerts check roughly once per minute and use desktop notifications.
- Historical candles are not an executable order-book quote.
- Pro entitlement validation uses the provider’s external service.
A closer look
Ratings & reviews
User reviews 0
The main score switches to user ratings after 5 published reviews.
A specific example helps the next person choose the right tool.
Write a review
How was your experience with PolyChart?
Share what you used, what worked and what could be better. We confirm your email and review the submission before publishing.
To submit a review, email info@polytradingbot.com with the tool name, your rating and your experience. Enable JavaScript to prepare a draft here.
Related tools
Browse category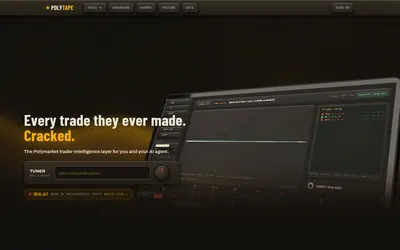

Replay a wallet’s entries and exits on charts to understand how its trading record was built.
- Access Web · API · MCP
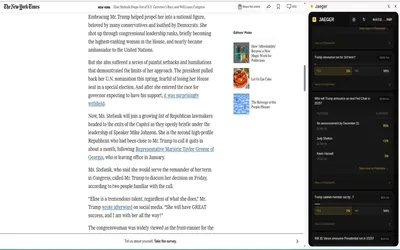

Find Polymarket markets related to the page or highlighted text you are reading, including a dedicated Twitter/X integration.
- Access Browser extension
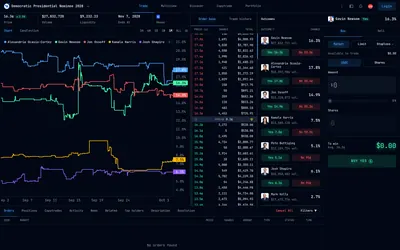

Inspect Polymarket charts, detailed order-book depth and outcome lists alongside a market/limit/stop-loss order workspace.
- Trading mode Manual
- Access Web
Frequently asked questions about PolyChart
Does it connect my wallet?
The listing describes chart access without a wallet connection.
Can I display multiple outcomes?
Pro supports up to eight overlays.
Are alerts instantaneous?
They use 60-second background checks.
Is the volume field actual exchange volume?
The listing calls it proxy volume.