 Polytoolhub

What is DefiLlama Prediction Markets?
DefiLlama Prediction Markets is a practical starting point for comparing activity across prediction-market venues. Its sector table brings several measures together, while the Polymarket profile provides a deeper view of protocol history and methodology.
The useful distinction is between discovery and explanation: use the sector table to spot a difference, then open the relevant protocol to understand what is included. Coverage can vary across products, and an empty metric should not be interpreted as proof of no activity. The calculation notes are particularly valuable when two providers report different figures.
Who it is for
- Researchers comparing prediction-market venues
- Developers checking metric definitions before building a report
Features and coverage
- Available on
- Web
- Markets & venues
- Polymarket
- Research topics
- Prediction-market activity
- Sector comparison
Compare prediction-market protocols using the same table and time window.
- Polymarket history
Inspect protocol-level series and distinguish a combined profile from its tracked products.
- Metric methodology
Read calculation notes and follow linked adapter code when figures differ between providers.
- Multiple activity measures
Review volume, fees, revenue and locked capital without treating them as interchangeable.
- Data workflows
Use public endpoints for supported data, or review the separate premium API offering for additional coverage.
Workflows with DefiLlama Prediction Markets
Compare Polymarket with another venue
Choose one metric and period in the sector table. Open each protocol profile to check coverage and definitions before drawing a conclusion.
Explain a mismatch between charts
Check whether a page covers a parent protocol or an individual product, then compare volume definitions, date ranges and methodology.
Build a repeatable research note
Record the metric definition and observation date with the chart. For recurring analysis, check whether the required series is available from a documented public endpoint.
Pricing and total cost
Core dashboards and public API endpoints are free. The annual Pro offer is $490/year ($40.83/month equivalent). Premium API access is a separate plan.
Free
$0
- Core protocol and sector dashboards
- Supported public API endpoints
Pro
$490/year; $40.83/month equivalent
- Research and AI features, custom dashboards and Sheets
- CSV downloads; premium API access is not included
API / Enterprise
Contact the provider for current pricing
- Premium endpoints and higher allowances
- Enterprise data and licensing options
Fees and usage costs
- The API plan advertises 1M calls/month, 1,000 requests/minute and $0.60 per 1,000 additional calls.
Trial: The pricing page offers a seven-day Pro trial.
Access: The displayed Pro amount is an annual-billing equivalent, not a verified monthly-billing quote.
Getting started
- Open the prediction-market category.
- Choose a metric and consistent comparison period.
- Open a protocol profile and read its methodology before exporting or quoting a value.
Useful links
What to check
- Missing metrics are not zero activity. Coverage differs between protocols.
- TVL, open interest, fees and trading volume measure different things.
A closer look
Ratings & reviews
User reviews 0
The main score switches to user ratings after 5 published reviews.
A specific example helps the next person choose the right tool.
Related tools
Browse category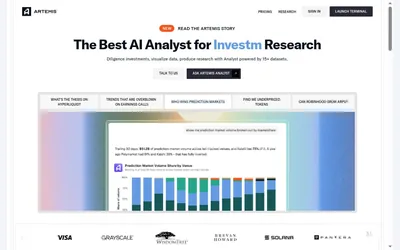

Research prediction markets alongside other financial data, ask scoped questions, and take results into charts or spreadsheets.
- Access Web
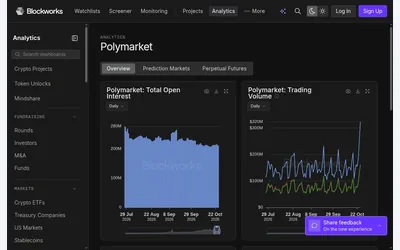

See which Polymarket markets and wallet segments drive activity, with charts for volume, open interest and participation.
- Access Web
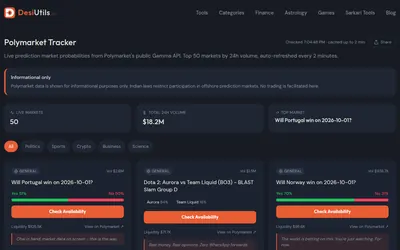

Browse a free, account-free view of the 50 highest-volume Polymarket questions, with probabilities, liquidity and simple topic filters.
- Access Web
Frequently asked questions about DefiLlama Prediction Markets
Is the prediction-market dashboard free?
Core dashboards are included in the free tier. Paid features such as custom dashboards, CSV downloads and enhanced research have separate plan requirements.
Is $40.83 the monthly subscription price?
The retrieved offer pairs $40.83/month with $490/year. It is the annual-billing equivalent; check the billing selector for a monthly-billing offer.
Does Pro include the premium API?
No. The pricing page separates Pro research features from premium API access. Free public endpoints remain a separate access route.
Why can Polymarket figures differ across pages?
A combined protocol page can include several products. Different windows and definitions of volume, open interest and TVL can also produce different results.
Can I use the figures to judge a trader?
These are protocol and sector metrics. They do not by themselves establish an individual wallet’s returns or suitability for copying.