 Polytoolhub
What is Kalshinomics?
Kalshinomics organizes market discovery into separate Kalshi, Polymarket and Unified sections. It combines searchable event tables with exchange-level summaries, news and experimental Labs views. The oil dashboard illustrates the approach: place an underlying asset’s context beside event probabilities rather than reading either in isolation.
Who it is for
- Users researching both major venues
- Readers following daily movers and weekly summaries
- Researchers comparing underlying assets with event contracts
Features and coverage
- Available on
- Web
- Markets & venues
- Kalshi, Polymarket
- Venue sections
Open Kalshi, Polymarket or a combined view.
- Event and market tables
Use the appropriate discovery level for a question.
- Exchange overview
Compare coverage and activity measures.
- Weekly intelligence
Read market digests and mover summaries.
- News and insights
Follow reporting and explainers.
- Labs
Explore purpose-built research views.
- Oil dashboard
Read CL spot context alongside probability and positioning.
- Market explorer
Navigate from broad coverage into a selected contract.
Workflows with Kalshinomics
Compare venue coverage
Search the same event in the unified view and open each source contract.
Prepare a weekly review
Read the digest, then investigate large changes in the relevant table.
Study an oil event
Compare the underlying asset context with the exact prediction-market threshold.
Pricing and total cost
The public site offers discovery and research without a displayed subscription price.
Getting started
Before you start: Combined tables can contain differently defined contracts.
- Choose a venue or Unified.
- Search the event and apply filters.
- Inspect volume, open interest and probability separately.
- Open a Labs view if relevant.
- Follow the source contract for rules.
Useful links
What to check
- Combined tables can contain differently defined contracts.
- Some homepage aggregate counters load dynamically; use populated tables rather than placeholder totals.
- Underlying asset price movement does not uniquely determine an event probability.
A closer look
Ratings & reviews
User reviews 0
The main score switches to user ratings after 5 published reviews.
A specific example helps the next person choose the right tool.
Write a review
How was your experience with Kalshinomics?
Share what you used, what worked and what could be better. We confirm your email and review the submission before publishing.
To submit a review, email info@polytradingbot.com with the tool name, your rating and your experience. Enable JavaScript to prepare a draft here.
Related tools
Browse category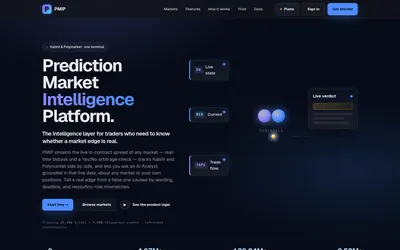

Compare venue prices and settlement rules, then investigate the gap with wallet flow and news.
- Trading mode Read-only
- Access Web · Discord · Email
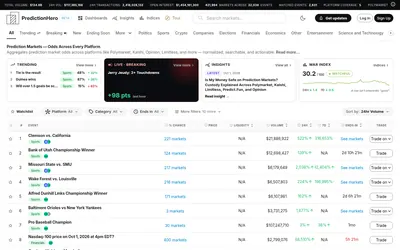

Search event probabilities across prediction venues, with matched-event groups, liquidity filters, watchlists and thematic indices.
- Access Web · Email
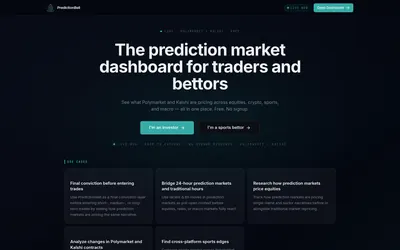

Compare Polymarket and Kalshi prices in a sports screener and a market-pulse view for equities, crypto and macro events.
- Trading mode Read-only
- Access Web
Frequently asked questions about Kalshinomics
Does it include Polymarket?
Yes.
What is Labs?
A section for focused experimental market tools.
Is this an order-entry bot?
The reviewed product is discovery and research.